
How you prepare and optimize your engineering and manufacturing design data is a key step in delivering a smooth experience to your chosen Extended Reality - XR device.
Whether you have invested in Augmented, Mixed, or Virtual Reality technologies or developed in-house apps, you will struggle to meet the visualization needs of your XR use case if your data is not optimized correctly.
It is essential to understand how the quality and performance of the XR experience is determined by how your 3D data is optimized.
3D models can have several million polygons (mostly triangles, but sometimes more complex shapes). Low-poly 3D models typically use few polygons, whereas high-poly 3D models use more polygons and will have higher visual quality.
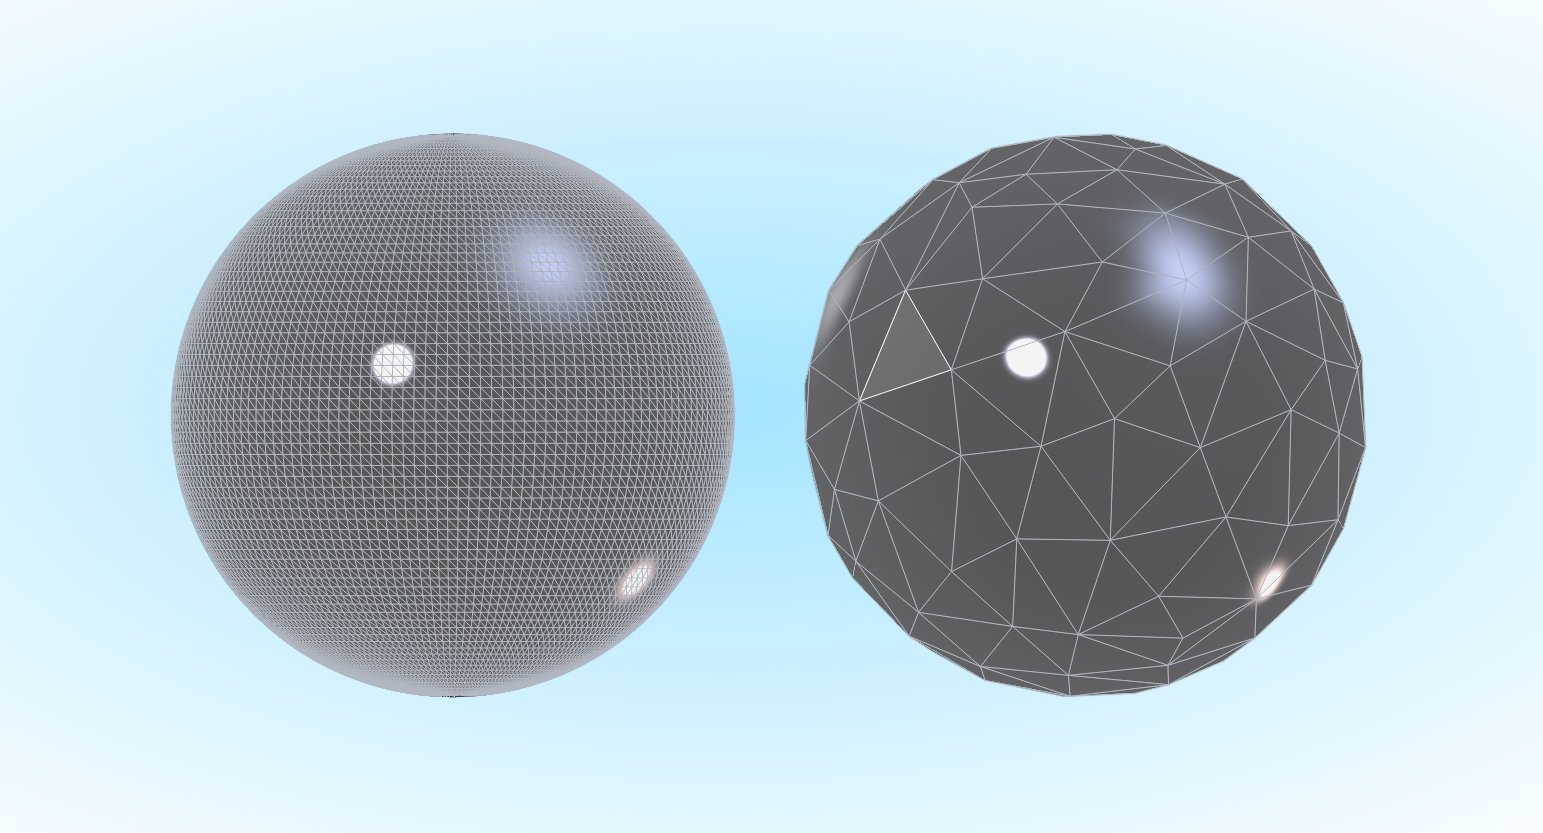
Take this example of a sphere.
The left sphere is high in quality. It has a high polygon count and has a very detailed curvature with precise measurements.
The right sphere is much lower in quality. It has a lower polygon count and has very rough edges. However, this is a much lighter file, meaning it will perform better and might be convenient in a situation where interactivity and speed is more important.
With XR technology, there will always be a trade-off between quality and performance which will in part be caused by hardware limitations. However, as technology evolves, some of these limitations naturally dissipate.
A typical limitation that we will discuss is trying to get large and complex datasets into a device that just can’t handle the data. You need to find a robust solution that can handle any 3D data types as an input, and prepare and optimize for output to a variety of devices and formats.
Here are some tips on how to optimize your 3D design data for your Augmented, Mixed or Virtual Reality use case, regardless of its size or complexity.
Jump to:
• Working with large data
• Working with small data
• Working with multiple data types and formats
If you're working with large data
There are several different approaches that you can take when it comes to full scale visualization of complex 3D data sets, but it all comes down to your use case.
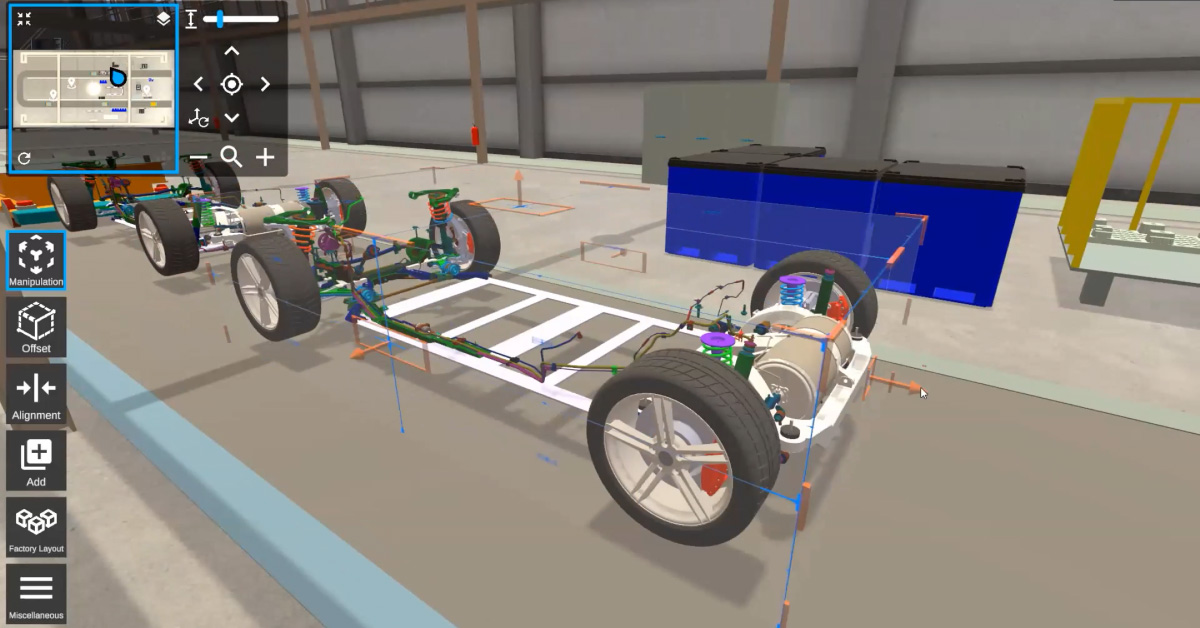
If you’re working with a large-scale data set like a factory, you’re typically going to be involved in scenarios where small details aren’t as important, such as assessing spatial assessments and looking at accessibility. In this scenario, you can optimize the data by removing certain small components that aren’t required to complete the task.
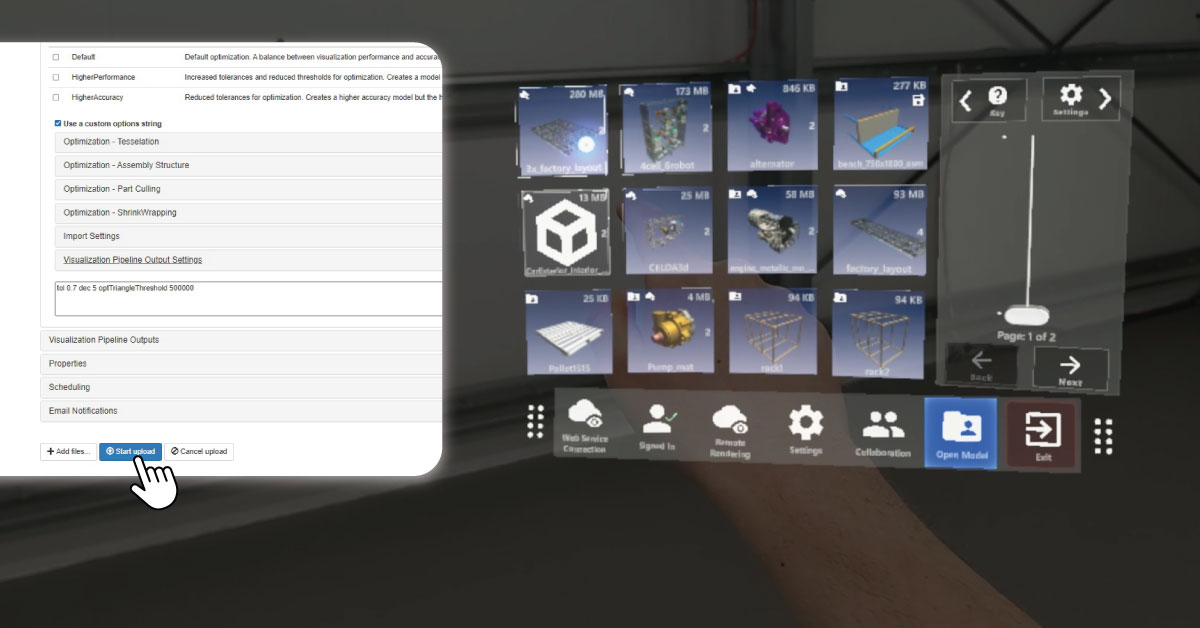
The Theorem Visualization Pipeline (TVP) has a range of optimization features that enable you to define bounding boxes and remove unnecessary parts, such as small nuts and bolts.
For use cases such as factory layout and planning, reducing the polygon count will make a huge difference to your data. This will make large datasets far more manageable within your device. Reducing excessive quality of the data will help a great deal with the overall performance.
Learn more about optimization features for XR.
If you're working with small data
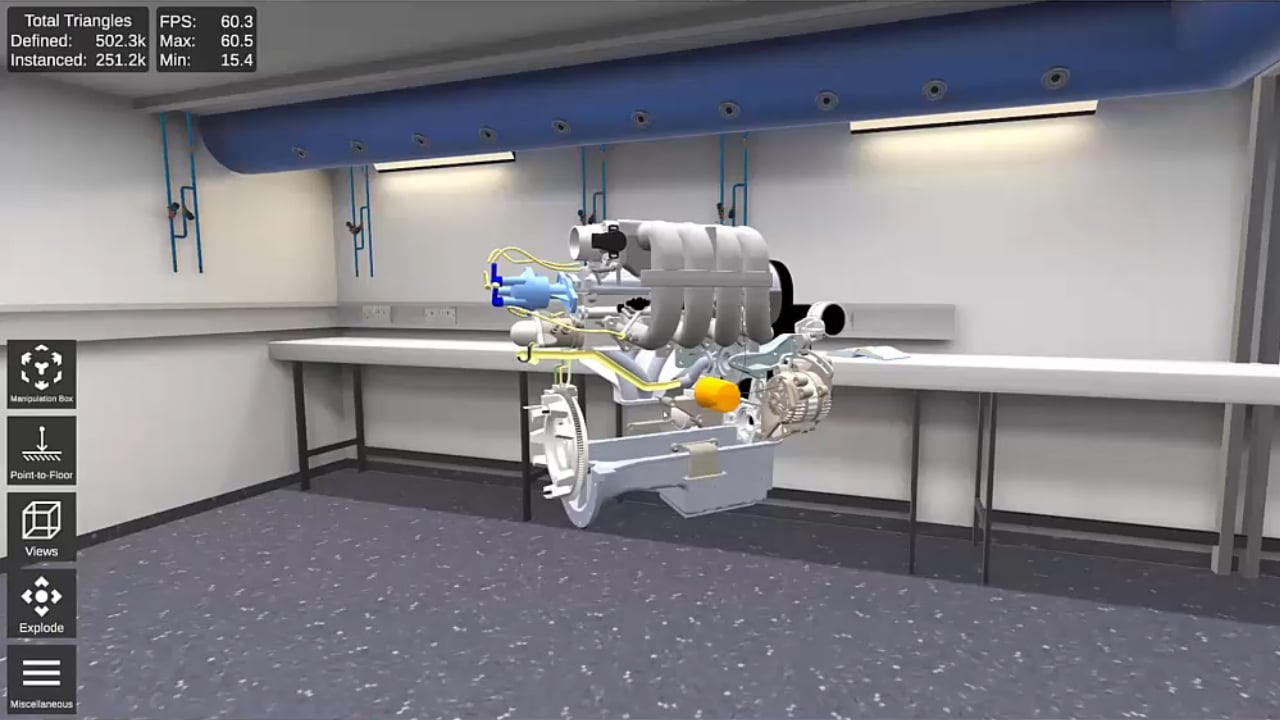
If your use case requires you to focus on small assemblies in detail, such as a design review, you’ll need them to look as visually appealing as possible.
You also want to trust the data that you see, in order to work efficiently around it. This means you’ll need to focus on maintaining the quality rather than taking a drastic approach to optimization, to ensure that you’re not missing any data.
However, when you’re working with smaller datasets, you might still find that some parts and components aren’t required for your use case. For example, if you’re conducting a design review on a car engine, you might only be looking at the outer sides of the design. In this scenario, you could remove the internal parts of the engine. This can be done using the Shrink Wrapping tool using the TVP. Again, this will help to improve the overall performance.
 You can also take a hybrid approach. It might be that you want to shrink wrap certain components, but you have other components from suppliers that you want to keep in full detail. By taking a hybrid approach, you can be more selective about which components are optimized to meet your use case requirements.
If you're working with multiple data types
If you’re working with small datasets, preparing models for full scale XR visualization isn’t too complex. However, if your use case requires you to bring a wider range of data types into an XR session, you will hit a roadblock without the right solution.
For example, for factory planning, you might look to bring in a mix of scan data, SOLIDWORKS data for your conveyor or some of your machinery, and CATIA data for a gearbox or an engine component that you want to bring into the layout.
The Theorem Visualization Pipeline (TVP) is an enterprise-ready, data and device agnostic software solution. It enables data of all types to be prepared and optimized for full-scale XR visualization. This means you can merge a range of inputs into one scene, depending on your requirements. Whether it’s CAD data (such as CATIA V5, 3DEXPERIENCE, Creo, or NX), BIM data (such as Revit or Navisworks), or whatever else is required, the TVP can handle any data type.
See a list of supported formats for use in XR.
Key Takeaways
Here are some of the key takeaways on how to optimize your data to best suit your XR use case:
Prioritize performance where possible – When you’re working with larger data sets, detail isn’t always necessary. Going overboard can result in reduced performance. Instead, consider a heavier and more drastic approach to optimization by removing parts and components that aren’t essential.
Only focus on detail where required – High detail often comes with a high polygon count. When it comes to your use case, consider what parts and components are really required, and which ones are not. A lower polygon count will result in a faster processing time.
Take a data-agnostic approach – Having a solution that enables you to bring in and merge any input into one XR scene could be a huge step in maximizing your XR experience. Without this, you will really limit yourself and will be forced to play with lots of different file formats to squeeze it into a scene, which can be extremely time-consuming.
To learn more about how to prepare and optimize your data for full-scale visualization and collaboration in XR, get in touch with our team of specialists or book a Theorem-XR demo today.


