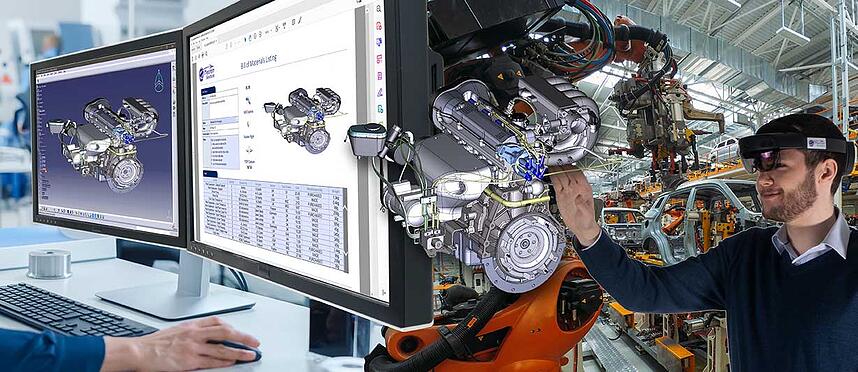
When a person or organisation is starting out on their journey into the world of XR, it’s easy to get carried away by focusing on the cool headsets and hand gestures that make you look like Tom Cruise in Minority Report.
People don’t always realise that to get to this point, they need to make sure that they can get the data they want to play with, into the cool headsets in the first place- and that this can often be the main stumbling block that can put people off from using XR technologies at all.
We recently ran a webinar focusing on our Visualization Pipeline software that enables users to import their 3D data, optimise it and then stream it to their device of choice.
Watch the Visualization Pipeline: How to automatically get your 3D CAD data into XR webinar in full.
Here are the key points:
1. What is the Visualization Pipeline?
The Visualization Pipeline is the backbone of our Theorem-XR software.
Theorem has worked in the world of mechanical CAD for almost 30 years. It is this 3D foundation which is the cornerstone of Industry 4.0, so providing innovative solutions to assist this new connected digital future, was a logical development for Theorem.
“It was through the appreciation that a person needs to have their data in context and at full scale to fully understand it that led to the creation of Theorem-XR.”The initial focus was on the important matter of getting 3D CAD assets into XR experiences in a simple and efficient manner. To achieve this, the Visualization Pipeline was developed.
2. Loading your data in- It’s as simple as drag and drop
The pipeline is a server based technology and is based on Theorem’s CADverter technology, which has been used by many OEM’s in manufacturing, to translate their 3D assets from one form to another for 30 years (so we know what we’re doing!).
Loading your 3D data into the Visualization Pipeline couldn’t be more simple. You can upload data right from within your CAD session by using Save As, you can drag and drop it in, or the pipeline can be connected to your PLM system so it can check out your CAD model.
3. Optimise...
The Visualization Pipeline offers a variety of processing settings that will optimise your data to the best possible standard for use in XR. As standard, the Visualization Pipeline provides predetermined configuration settings (default, higher performance and higher accuracy) that have pre-defined tolerances, decimation and triangle thresholds.
4. ...Customise...
Or you can customise these settings for yourself using the custom options string. You might find that you need specific optimisation settings for specific data types as you may realise that one size does not fit all.
“If you’re translating something very small, the settings are probably going to need to be different to if you’re translating something very large.”The Visualization Pipeline offers numerous optimization settings so that you can choose the level of detail in the data that you want to then stream to your chosen device:
- Shrink Wrapping- This is a method of removing internal components. By excluding these, there are fewer triangles to render. Use a lower accuracy setting speeds up your processing time.
- Part Culling- This removes smaller parts that are deemed unnecessary, de-cluttering your model and reducing the triangle count, resulting in more lightweight data. This can be particularly useful if there are components within your model that are not particularly relevant for your project.
- Model Decimation / Tessellation- Reducing the number of triangles in models improves the visualization performance. By setting larger tolerance values, more triangles will be removed at the expense of accuracy. By setting the decimation to high, this will speed up the processing time.
- Assembly Structure-Boost performance by collapsing complex assembly tree structures. This can be particularly useful when your source data has a complex assembly tree with a large number of objects. You can also combine multiple nodes into a single part.
5. ...and then pick your output
We designed the Visualization Pipeline to optimise the output for all visualization workflows, supporting VR Caves and Powerwalls, but also supporting photo realistic rendering such as Alias, VRED and 3DEXCITE, existing lightweight viewing technologies such as JT, Creo View, glTF and 3DXML, or an FBX file for use in XR based technologies powered by Unity and Unreal Engine.
6. Additional Benefits
Aside from the range of optimisation options and output formats available that makes the Visualization Pipeline the obvious way to create XR assets from 3D CAD data, it also has a number of additional non-data related benefits:
- Fully automated CAD processing-being fully automated saves time and reduces cost by eliminating manual activity while maximising visualization performance and quality. There is no manual manipulation of files at all. Everything is done automatically.
- PLM integration-Being an enterprise solution means it can be fully integrated into your PLM processes with minimal effort and cost. PLM integration means you can have a fully managed solution for XR content creation, eliminating duplication of data and ensuring data conformance to IT policies.
- Data authentication-it supports single sign on and user authentication to ensure workflows and data access are managed, ensuring control of data.
- Job scheduling-being able to schedule jobs means valuable computing resources are used to optimum effect, controlling costs.
New eXtended Reality solutions and devices for delivering XR experiences are evolving at a breathtaking pace. However, without content they deliver no value. So with a tool like the Visualization Pipeline available, don’t let problems with creating content because of poor quality data become the reason you pass on using these innovative and futureproof technologies.


